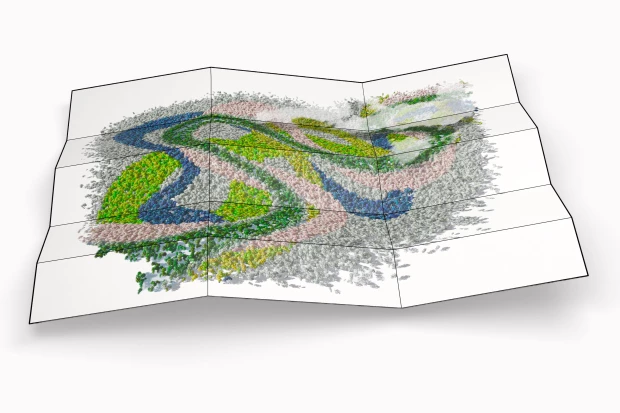
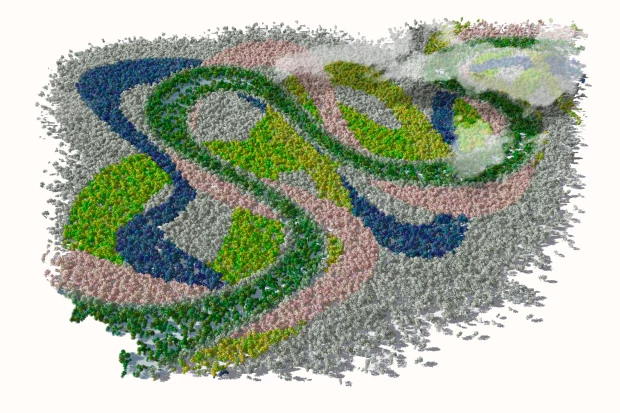
Saud, a remote sensing scientist from USGS, begins the interview by mapping out the different institutions that produced the “WATEX Hydromorphy Map”(2018), shown above. WATEX is a method developed by a company called RTI (Radar Technologies International) Exploration. According to its creators, the WATEX method uses a series of data sources that together can be utilized to produce maps indicating the potential presence of aquifers at different depths. WATEX has been employed in different countries, Costa Rica being one of them.
The map, and the multivolume report it is a part of, are products of a partnership between the USGS (United States Geological Survey), academia, Costa Rican State Institutions (Dirección de Aguas - Water Directorate, MINAE - the Ministry of Environment and Energy). There were four components to the method. Remote sensing, done by RTI, hydrogeology which was done by the USGS, the economic assessment which was done by New Mexico State University.
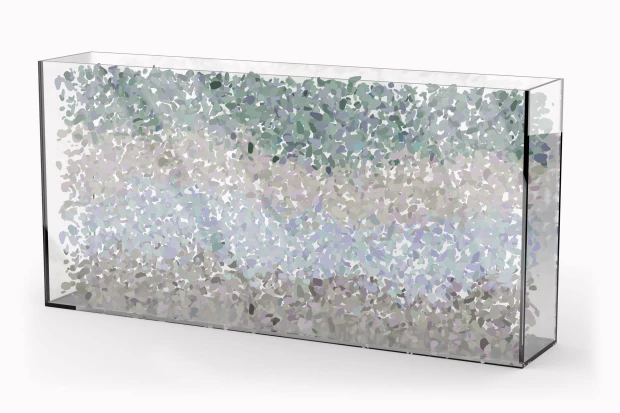
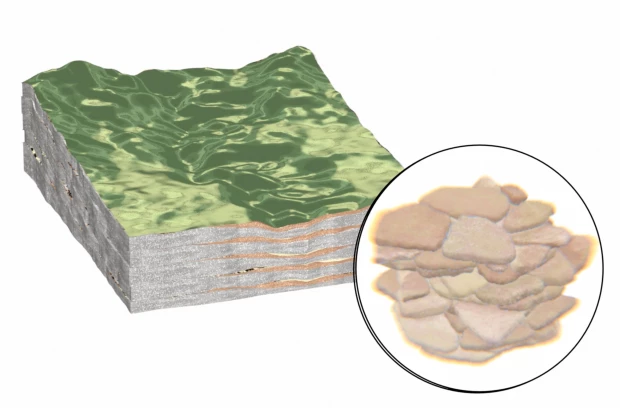
Saud says that the use of remote sensing to study moisture is not new science, in fact it’s very old science. Remote sensing works in different wavelengths in the spectrum of light, different frequencies, so the question here is how you filter those and combine them with different data. In the WATEX method they used optical satellite data, working with what is in the visible spectrum. It was combined with microwave remote sensing, and with other datasets, including lithology, oil or water well lithology, geophysical data, land use and land cover.
The algorithm (he adds - “if you want to call it that”) filters everything out except moisture. Saud emphasizes here that everyone uses the same data, city planners, foresters, agricultural researchers, or hydrogeologists, “we all use the same data”. The difference is all you filter and combine the data to look at the particular phenomena you are trying to capture. Remote sensing is interdisciplinary, it goes beyond the satellite data. He lists the different forms of knowledge you must have to do a remote sensing study: from physics, electric engineering, mining, agronomy, just to name a few.
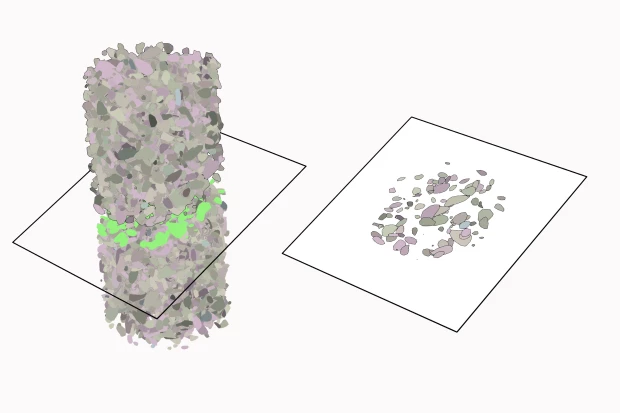
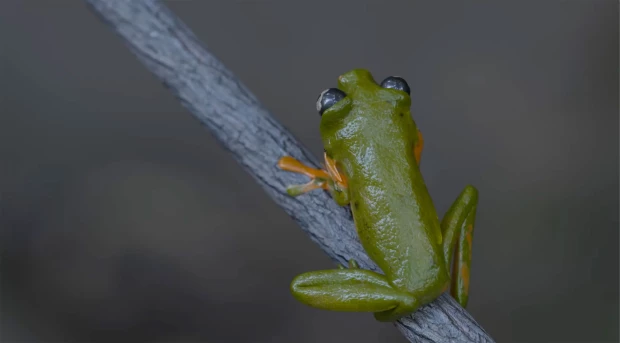
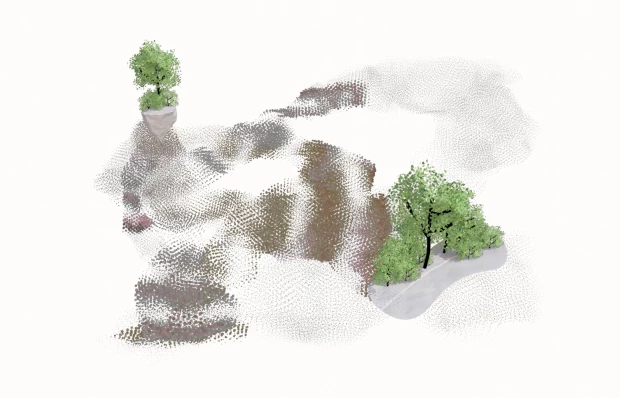
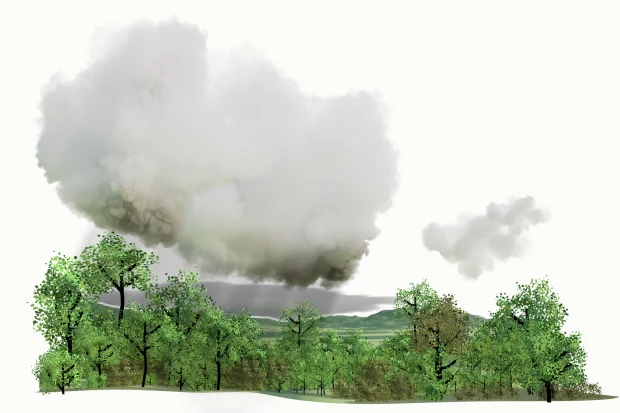
Saud emphasizes that “remote sensing cannot see the aquifer”. There is no wavelength that can penetrate that deep into the earth’s surface. So you must gather “evidence”. Vegetation can be an indicator of water, different geomorphological formations such as outcrops or fractures, are also “evidence”, “so based on my convergence of evidence, here is a map of the potential presence of groundwater”. This is the map that WATEX produced, a map of the potential presence. Groundwater is represented in maps through potential. What is interesting is that evidence is usually associated with “fact”, something solid and definable. In groundwater maps, this evidence can only surmount to a certain potential. A probability that perhaps, there is groundwater under our feet.
And yet, maps construct narratives, “A map organizes the entire narrative, both for the author in the process of composition and for the reader in the process of comprehension. No story without a map.” (Grønfeldt Winther 2020) What kind of narrative was the WATEX map constructing? Indeed, a part of this narrative is also constructed through the geopolitical relations between the United States and Costa Rica, in which science has been used also as a mechanism of control and regional domination by the US (See Isla 2015, Delgado Ramos and Gian Carlo 2015). This relationship can be seen very plainly in the following statement:
Saud: [00:14:51] So what we have done for Costa Rica, Costa Rica has very good technical people. Actually, they have done a lot of good hydrogeological work, but what I call it is a postage stamp. They take a small area and they dig deeper and deeper and deeper into the research. So this project, what it gives them, it gives them all Costa Rica on one sheet of map showing all Costa Rica. So they could plan better. [00:15:31][39.2]
“Doing for” and “giving”, words and phrases that denote a power over another. But what also catches me about this statement is the description of the research that was previously done is like a “postage stamp”, a small area incapable of being extrapolated to seeing the whole. In other words, what he is describing is “giving” Costa Rica a “totalizing view”, the map of the whole country on a single “sheet”, so that they might be able to “plan better”.